
Beyond the Tailpipe (Part 2): The Comprehensive Guide to Optony’s Lifecycle Carbon Analysis
The Deep Dive
In case you missed our first part of this series, let us explain. We set out to answer some questions that continue to come up in our discussions with clients, such as: are electric car batteries bad for the environment? How are we disposing of these vehicles at their end of life? Where are manufacturers sourcing the raw materials from and is the process of extraction hurting the environment?
These are all important questions as we begin this shift toward zero-emission vehicles. It’s essential to understand the comprehensive, cradle-to-grave, environmental impact of EVs.
As a clean energy consulting company, Optony is determined to provide robust, sustainable solutions, based on actualized data and practical methodologies. We have decided to answer these questions for ourselves, performing an extensive review of scientific studies on lifecycle carbon emissions coupled with an in-depth, in-house lifecycle carbon analysis.
You came to the right place if you are interested in the answer to the biggest question of them all:
Are BEVs actually more environmentally friendly than ICEVs?
We’ll give you sneak peak into the final answer… Across Optony’s lifecycle carbon analysis, which is designed to simulate parameters for the an anonymized municipal fleet, and the more generalized literature review, BEVs were consistently found to exhibit approximately 64% lower cradle-to-grave greenhouse gas (GHG) emissions than ICEVs over their complete life cycle.
Before we go any further, here is a cheat sheet for abbreviations:
- BEV = battery electric vehicle (cars powered by electricity)
- ICEV = internal combustion engine vehicle (cars powered by gas, diesel, natural gas, ethanol)
- GHG = greenhouse gas emissions (often measured in weight of carbon dioxide equivalent units, such as metric tons of CO2e or “MTCO2e”)
- GVWR = gross vehicle weight rating (maximum weight capacity of a vehicle)
- LD or MD or HD = light-, medium-, heavy-duty vehicles based on gross vehicle weight rating
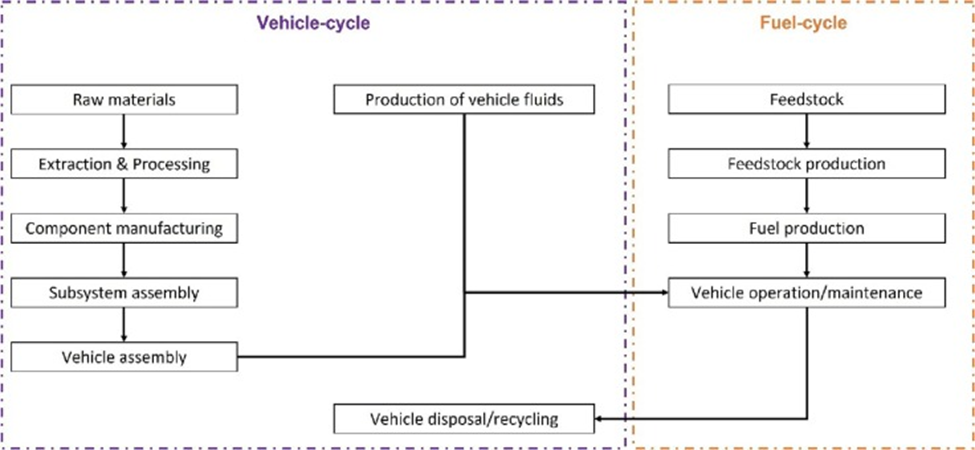
Regardless of the body type or class of the vehicle being assessed, the 5 lifecycle stages in this analysis are assumed to be the same for all vehicles. The GHG emissions associated with each lifecycle stage can vary depending on the parameters involved in the processes and activities of, for instance, extracting minerals or manufacturing batteries or recycling of a vehicle.
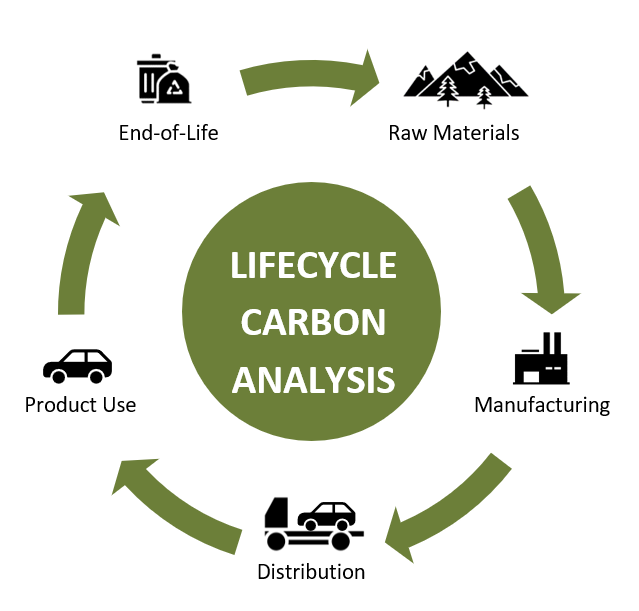
Let’s start with the raw materials. The raw materials stage involves the procurement and processing of all vehicle component materials such as metals and minerals, which often have extensive environmental implications. Factors like extraction methods, geographical locations, and ecological considerations significantly influence the carbon footprint of this stage.
Next, the manufacturing stage is where these materials are transformed into a complete vehicle. In the manufacturing stage, typically the GHG emissions of assembly, batteries, components, and fluids correspond to the size and weight of the vehicle body type. The values of GHG emissions attributed to the manufacturing stage is based on available data from existing literature review, subdivided according to the vehicle-cycle GHG emissions graphics.
The distribution phase consists of the delivery of the product (i.e., an ICEV or a BEV) to the consumer. In this analysis, it is assumed that the emissions of this delivery are equivalent between ICEVs and BEVs, since both vehicle types would likely be transported using a car hauler, which is a type of trailer meant to transport passenger cars.
Perhaps the most drastic influence comes from the product use stage. Going back to our sample municipal fleet, there is a huge difference in the emissions of the BEV product use stage when you compare between using 100% renewable electricity and a rough average of the 2023 California electricity grid. To ensure a comprehensive analysis, electricity grids with varying carbon intensities are included in the cradle-to-grave assessment. The fuel-cycle, whether gasoline, renewable diesel, biodiesel, diesel, or electricity-based, is the primary contributor to GHG emissions over the vehicle’s lifetime.
Based on the data, the product use stage contributes to the majority of the GHG emissions over the lifetime of BEVs and ICEVs. However, as previously mentioned, the GHG emissions produced within the vehicle-cycle and the fuel-cycle portions of ICEV and BEV lifecycles can vary. For various vehicle body types, GHG emissions were proven to be greater during the vehicle-cycle stage but were significantly offset by the fuel-cycle stage. It is reasonable to assume the lifecycle GHG emissions of any electric HD vehicles, such as electric street sweepers, will likewise be directly affected by their fuel economy, or in other words, how efficient the vehicle is at using the fuel in its tank (or battery).
Finally, the end-of-life stage concludes the lifecycle, addressing vehicle disposal, recycling, or refurbishing after its useful life has ended. When a vehicle reaches its end-of-life stage, there are various methods of recycling, refurnishing, or scrapping that may be utilized to recover or dispose of the materials initially used to furnish the vehicle. This stage can be considered one the most challenging aspects of a life cycle assessment, due to a lack of available data regarding the allocation method and waste management practices in the end-of-life disposal of vehicles.
The findings from the literature review directly inform the results of Optony’s lifecycle carbon analysis, with additional input and parameters from the sample municipal fleet. As promised, here are the results of Optony’s lifecycle carbon analysis across the 5 life stages.
Figure 1: GHG Emissions by Stage from Optony’s Lifecycle Carbon Analysis
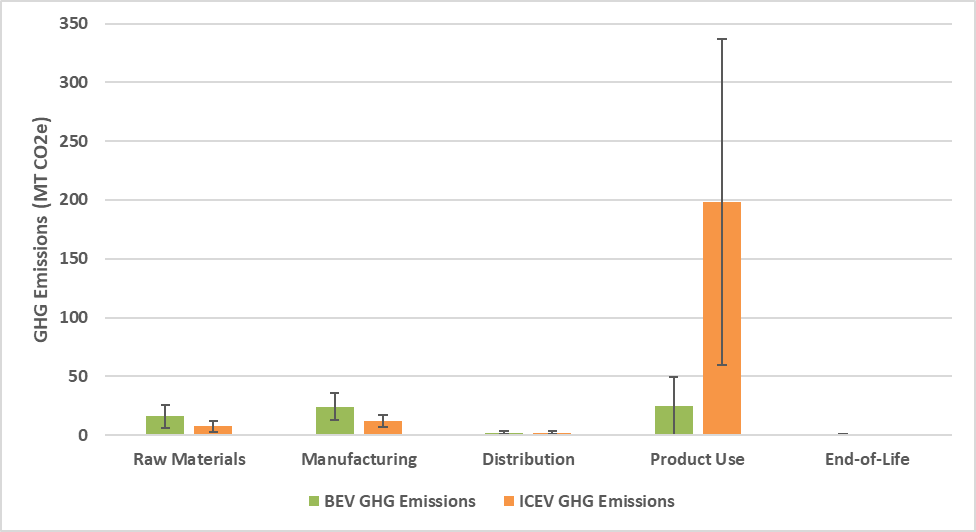
The variability of input parameters results in a standard deviation within the final summation of lifecycle GHG emissions. This is visualized in the form of error bars in all figures.
Now, we can further break down the GHG emissions by vehicle body type and vehicle class. For the purposes of this study, vehicles will be assessed according to their gross vehicle weight rating (GVWR) category according to the Federal Highway Administration and U.S. Census Bureau. Optony’s lifecycle carbon analysis focused on 5 vehicle body configurations: a light-duty sport utility vehicle (SUV), light-duty pickup truck (Class 1), light-duty pickup truck (Class 2), medium-duty truck (Class 5), and heavy-duty street sweeper (Class 7).

Figure 2 illustrates the variation of GHG emissions by vehicle body type and vehicle class based on results of an extensive literature review, stemming from industry-standard sources and assumptions. All literature review sources are listed at the end of the article for reference.
Figure 2: GHG Emissions by Vehicle Body Type and Vehicle Class from Literature Review
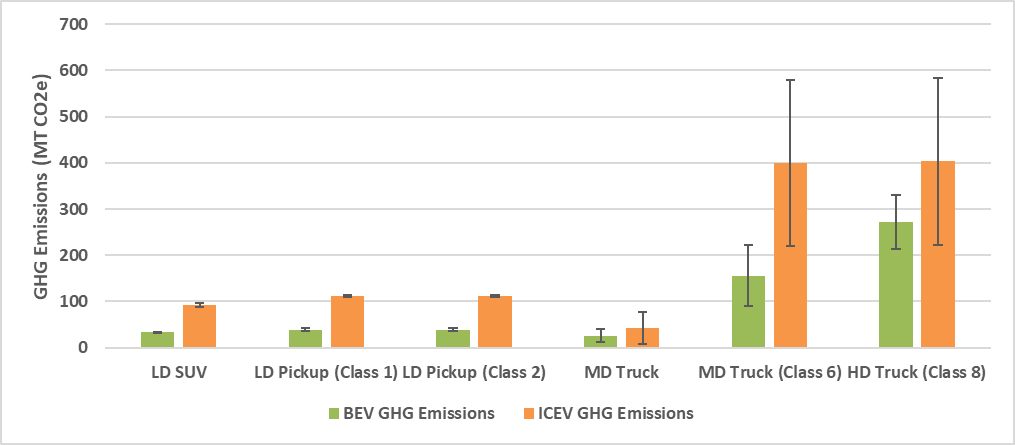
Although these are data-driven findings, there is an inherent margin of error associated with these emissions estimates. It can be assumed that variations between GHG emissions estimates across vehicle body types and GVWR ratings can be attributed to the differences in base assumptions regarding electricity carbon intensity, fuel economy, and battery manufacturing, among other parameters. The results of the literature review within each GVWR category directly inform Optony’s lifecycle carbon analysis.
Figure 3: GHG Emissions by Vehicle Body Type and Vehicle Class from Optony’s Lifecycle Carbon Analysis
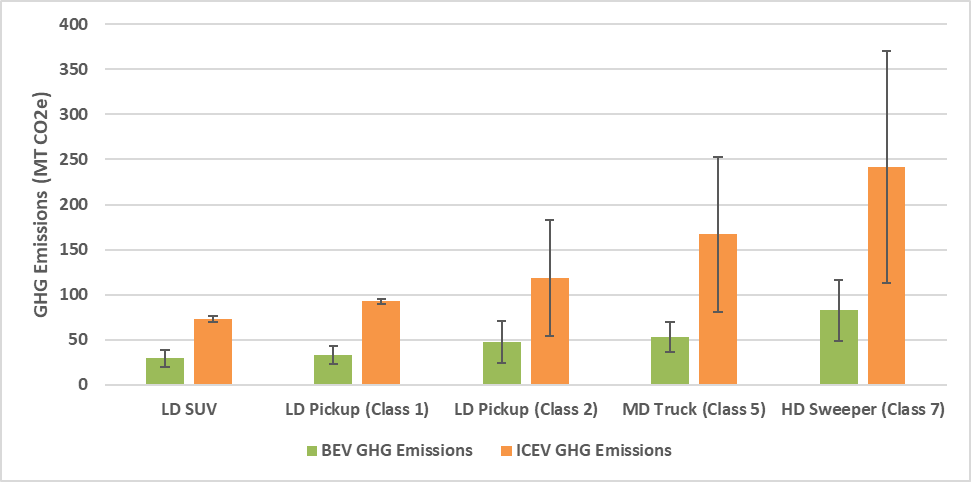
According to the study, “The Role of Pickup Truck Electrification in the Decarbonization of Light-Duty Vehicles” published in the Environmental Research Letters, researchers found on average that for sedans, SUVs, and pickup trucks, BEVs have approximately 64% lower cradle-to-grave GHG emissions than ICEVs over their complete life cycle. Optony’s lifecycle carbon analysis, the extent of which is presented throughout this article, corroborate these results when averaged across all vehicle body types included in the assessment.
Still with us? Great, here’s a peek behind the curtain:
The analysis parameters for sedans, SUVs, and pickup trucks were obtained from the Greenhouse Gases, Regulated Emissions, and Energy Use in Transportation (GREET) 2021 model for the vehicle-cycle and the fuel-cycle stages of ICEV, hybrid EV (HEV), and BEV usage.
Beyond the vehicle-specific parameters, carbon intensity of the electric grid plays a key role in determining the lifecycle GHG emissions of BEVs, since a BEV powered by electricity that was generated through solar or wind power will inherently be more environmentally sustainable than a BEV powered by electricity generated through natural gas.
According to the article titled “The role of pickup truck electrification in the decarbonization of light-duty vehicles” published by the Environmental Research Letters”, the emissions from disposal and assembly are relatively equivalent between BEVs and ICEVs, but the emissions from batteries, fluids, and component manufacturing vary significantly. These findings are used to inform the estimated for the lifecycle carbon analysis for the selected light-duty vehicles: SUV, pickup truck (Class 1), and pickup truck (Class 2). It is assumed that the Class 2 pickup truck will produce greater carbon emissions corresponding to its bigger battery size and components.
Figure 4: Vehicle-Cycle Emissions for Base Models
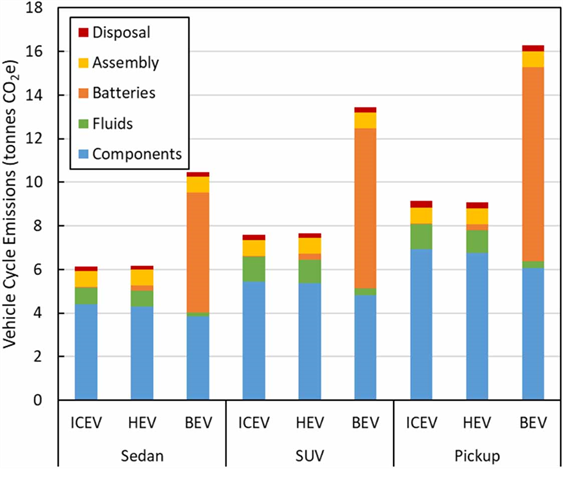
The GHG emissions produced from battery manufacturing for BEVs are approximately double that of ICEVs, which significantly influences the results of the comparison. However, the fuel-cycle emissions offset this influence over the standard assumption lifetime of 200,000 miles.
Figure 5. Cumulative Lifecycle GHG Emissions vs. Vehicle Mileage
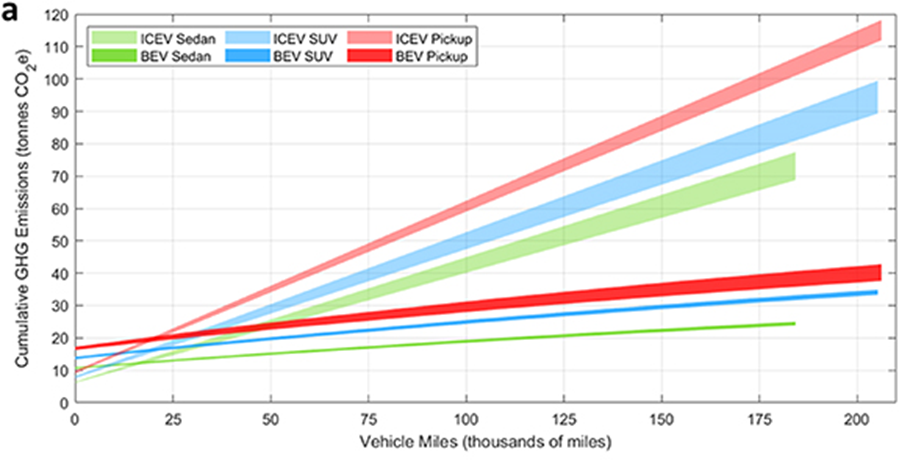
As illustrated in the figure above, the cumulative GHG emissions are greater for light-duty ICEV sedans, SUVs, and pickups as compared to their BEV counterparts, over the course of their lifetime. This overtake occurs roughly in the 10,000- to 25,000-mile range. This data is illustrated in a range to represent the lower and higher limits of the GHG emissions analysis for base and premium models, respectively, for sedans, SUVs, and pickup trucks. As expected, lower fuel economy ratings tend to correlate with higher cumulative GHG emissions.
The results indicate major environmental benefits to vehicle electrification and downsizing vehicles within their vehicle body type or switching to a different vehicle class (e.g., from an SUV to a sedan).
Compared to light-duty BEVs and ICEVs, medium-duty vehicles tend to be greater in size, weight, and payload capacity, which corresponds to greater lifecycle GHG emissions. BEVs for medium-duty vehicles usually come equipped with larger batteries to meet the higher energy demands of larger vehicles and longer distances. These larger batteries provide the necessary energy storage capacity to power the vehicle over longer distances and meet the operational needs of medium-duty trucks and chassis cabs, but they also contribute to a higher environmental impact during manufacturing.
Given the International Energy Agency (IEA) article, “The Role of Critical Minerals in Clean Energy Transitions,” the lifecycle GHG emissions are shown for base case BEVs, high GHG minerals case BEVs, and ICEVs. The study indicates that the raw materials stage of the lifecycle certainly contributes to the overall lifecycle carbon analysis, however, the product use stage (specifically the fuel consumption process) is the primary contributor to the difference in GHG emissions between BEVs and ICEVs.
Figure 6. Lifecycle GHG Emissions for Mid-Size BEVs and ICEVs
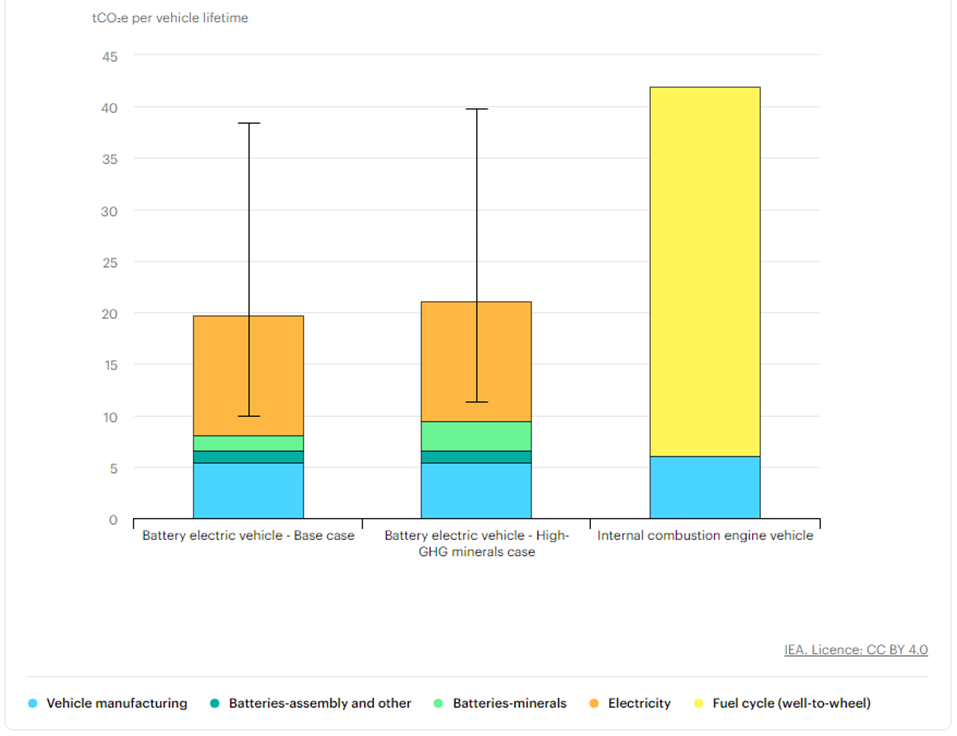
According to this study, the total lifecycle GHG emissions are calculated for an estimated mid-size BEV and ICEV, assuming approximately a 34.6 MPG fuel economy rating. However, based on representative EV options for the sample municipal fleet under review, Optony assumes 49 MPGe for a medium-duty BEV truck and 9 MPG for a medium-duty ICEV truck. Considering that lower fuel economy ratings correlate with higher cumulative GHG emissions, Optony’s lifecycle carbon analysis findings produced higher ICEV GHG emissions than presented in the literature findings.
On top of that, Optony’s lifecycle carbon analysis assumes that the sample municipal fleet medium-duty ICE trucks use 100% biodiesel, which is more representative of a sample California fleet. However, the IEA study for medium-duty ICE vehicles was based on gasoline-equivalent data. Given this discrepancy, it makes sense that Optony’s lifecycle carbon analysis gives different results than seen in other publications.
Finally, Optony found limited research available regarding electric heavy-duty vehicle lifecycle GHG emissions. However, there is research available on GHG emissions for Class 6 and Class 8 vehicles that details the carbon footprint of specific stages of life. As such, this research was extrapolated to inform the lifecycle carbon analysis for Class 7 heavy-duty vehicles.
Given in the article, “Vehicle-Cycle and Life-Cycle Analysis of Medium-Duty and Heavy-Duty Trucks in the United States,” the vehicle usage stage results in the highest percentage of GHG emissions out of all stages.
Figure 7: Vehicle-Cycle and Fuel-Cycle of Medium- and Heavy-Duty Vehicles
The vehicle-cycle GHG emissions are observed to be predominantly affected by the emissions of battery manufacturing for battery electric trucks (BETs). It is important to note that this study assumed battery replacements for Class 8 vehicles once over the course of the vehicle’s lifetime, which directly correlates to the increased GHG emissions from battery manufacturing. Here, the assembly, disposal, and recycling (ADR) portion of these emissions is relatively small compared to the emissions of the rest of the manufacturing stage.
Figure 8: Vehicle-Cycle GHG Emissions of Medium-Heavy Duty Vehicles by Component System
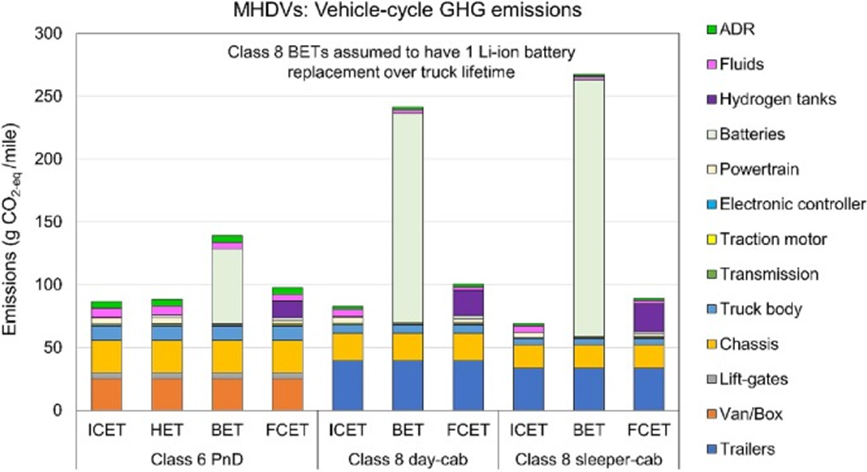
Figure 9: Lifecycle GHG Emissions of Medium- and Heavy-Duty EVs for a Baseline Scenario (2021)
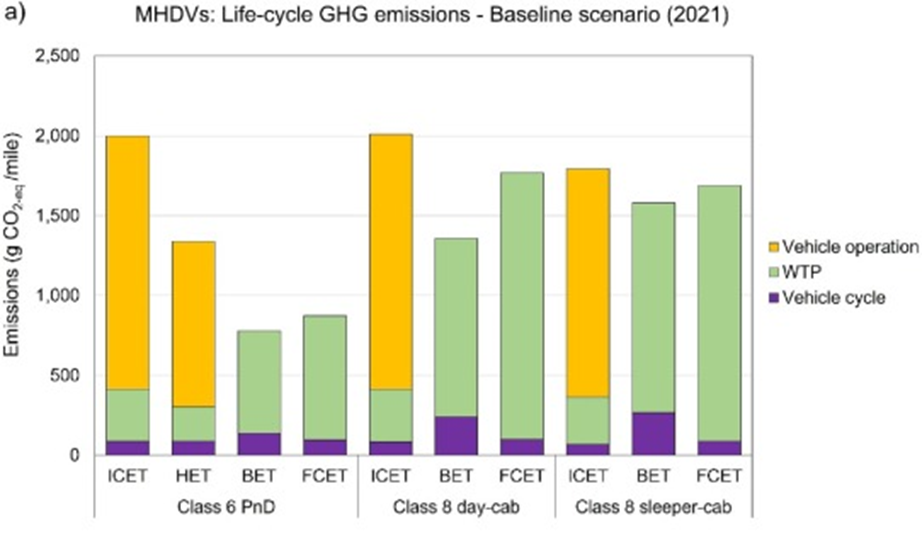
The primary influences regarding the vehicle-cycle emissions for medium-duty and heavy-duty vehicles appear to be the batteries, the main body (e.g., van/box and trailers), and the chassis. The body components are relatively similar for both BEV and ICEVs, but the powertrain substantially differs. However, when this assessment is expanded to additionally consider the fuel-cycle emissions, the lifecycle outlook of GHG emissions tips the scale in favor of BEVs.
Given this breadth of information across all different sources, Optony then carefully calculated proportional equivalents or estimations for the vehicle classes and body configurations studied.
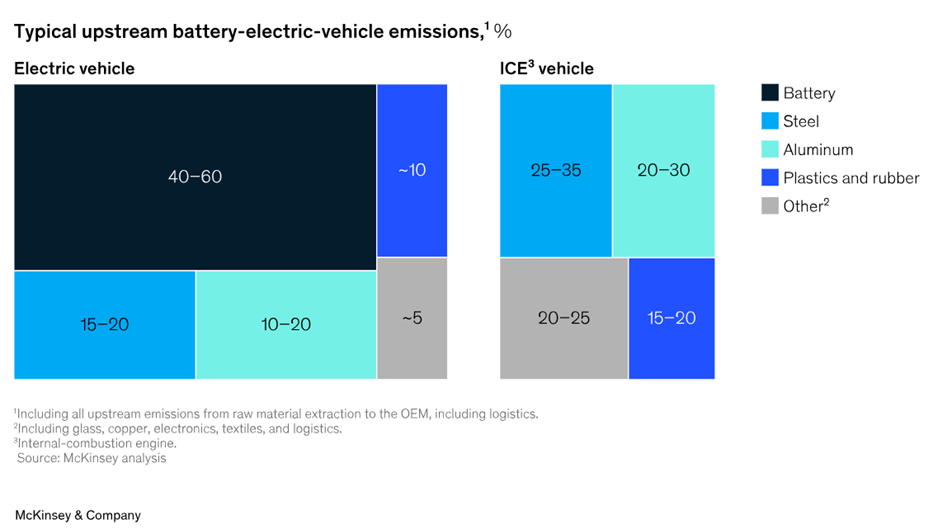
Available literature explored high GHG mineral extraction and base condition mineral extraction for batteries, which provided important information for the lifecycle carbon analysis. The analysis of upstream emissions for a BEV and ICEV not only accounts for the materials mined to manufacture batteries, but also materials needed to construct the vehicle, including steel, aluminum, plastics and rubber, glass, copper, electronics, textiles, and other materials. These estimates encompass mining, refining, chemical processes, and logistics, and other processes and activities of upstream emissions based on multiple production locations.
Figure 10: McKinsey & Company Typical Upstream BEV GHG Emissions
In the manufacturing stage, estimates for assembly, batteries, components, and fluids were collected according to the literature review results. These findings are approximately equal between BEVs and ICEVs, except for battery manufacturing. The GHG emissions estimates of battery manufacturing will directly correlate to the size of the battery.
This analysis did not explore alternate methods of delivery (i.e., railroad auto ramp or ocean liner). Since most vehicle-cycle and fuel-cycle lifetime GHG emissions analyses performed in literature review disregarded this stage due to equal comparative emissions between BEVs and ICEVs, the data for the distribution emissions was estimated based on the average distance traveled to deliver new vehicles to consumers. At this time, there are electric car haulers recently available on the market, so the distribution was modeled using either an ICEV or BEV transport, resulting in a range of estimated GHG emissions from the distribution stage. To this end, standard assumptions are applied to determine the expected carbon emissions of this life stage.
In the product use stage, for BEVs, the lifecycle carbon analysis considered electricity grids with varying carbon intensities, ranging from 100% renewable energy sourced electricity to the average intensity of the Cal ISO grid. ICEVs were calculated for various fuel types, including gasoline, diesel, biodiesel, and renewable diesel. These results are presented as ranges in Optony’s findings.
The estimates for GHG emissions from the end-of-life stage are different depending on the methods of recovery or disposal. The lifecycle carbon analysis assumed different methods of lithium-ion battery recycling (i.e., pyrometallurgical recycling and hydrometallurgy recycling). The GHG emissions from remaining general components of the vehicles are assumed to reflect the disposal stage emissions proportionally calculated in the literature review, as there is limited data available regarding the emissions of this stage.
It should be noted that this analysis may not comprehensively cover all inputs and outputs associated with lifecycle carbon emissions, and certain variables could remain unaddressed. The assessment focuses on the most relevant and available data provided by industry-standard and reputable sources and makes assumptions for information not yet available. The Optony Team would like to express our gratitude for all of the studies and publications which made this lifecycle carbon analysis possible.
As we observe our transition to zero-emission vehicles, it becomes clear that the environmental impact extends far beyond the road. Our analysis, echoing industry-standard study findings, reveals a consistent narrative:
Battery Electric Vehicles (BEVs) showcase an impressive 64% reduction in greenhouse gas (GHG) emissions compared to ICEVs across their entire lifespan.
Do you have a technically-challenging question related to electric vehicles, EV charging, solar, microgrids, or a combination of those that needs technical analysis? Bring us your questions and your challenges at Energy@OptonyUSA.com.
Resources:
https://afdc.energy.gov/data/10380
https://iopscience.iop.org/article/10.1088/1748-9326/ac5142
https://www.sciencedirect.com/science/article/pii/S0048969723027146
https://www.epa.gov/energy/greenhouse-gases-equivalencies-calculator-calculations-and-references
 Previous Post